The Hardware section of the Contents list in
System Profiler displays reports for various hardware components,
including buses supported by Mac OS X (for example, USB, FireWire,
and PCI). After clicking a bus type, the upper-right pane of System
Profiler displays a hierarchical view of the bus and devices
connected to the bus. Clicking a device in the upper-right pane
displays information about the device in the lower pane.
NOTE
System Profiler in Mac OS X 10.4 is
significantly improved from the previous version. It now supports
many more plugins, such as Power, Fonts, and Bluetooth, and reports
far more information about devices on peripheral buses.
System Profiler can generate reports of all the
devices connected to a computer. To see what devices are connected
to your computer, follow these steps:
|
1.
|
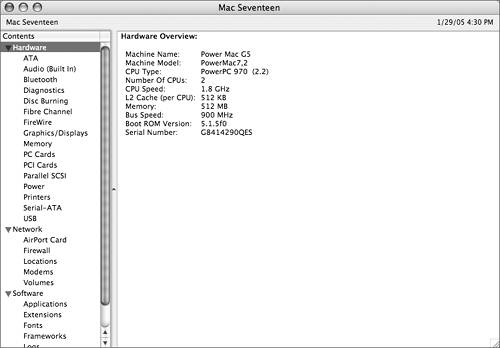
Open System Profiler
(/Applications/Utilities).
The System Profiler window displays the Hardware Overview.
The Contents list at the left lists the types of reports that
System Profiler can generate.
|
|
2.
|
If the Hardware item in the Contents list is
not expanded, click the disclosure triangle to list all of the
hardware reports.
 |
|
3.
|
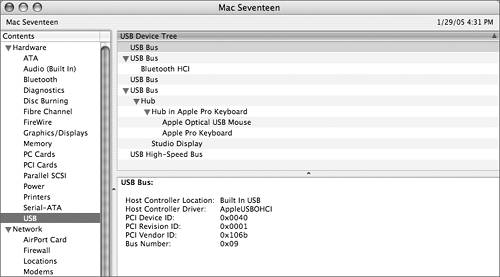
Select USB in the
Contents list.
Hierarchical lists representing the USB buses are displayed in the
upper-right pane. The built-in Bluetooth port, if available,
appears on the USB bus.
Devices connected to a bus are listed beneath the bus and indented.
In the preceding screenshot, nothing is connected to the first USB
bus, and a hub is connected to the second bus. The lower-right pane
displays details about the currently selected bus or device.
If a device is connected to a hub, it is listed beneath the hub and
indented. In this example, a Studio Display is connected to the
first hub. The mouse and keyboard are connected to the keyboard's
hub.
NOTE
Do not be confused by the fact that the keyboard
is listed under a hub, which is located inside the keyboard itself.
If a device allows other devices to be connected to it, it is
actually a hub with the device (the keyboard in this case)
connected to that hub.
|
|
4.
|
Locate and select the mouse in the USB report
for your computer.
Details about the mouse are displayed in the lower-right
pane.
|
|
5.
|
Being careful not
to click the mouse, unplug the mouse and move it to a different USB
port, such as to a different free port on the computer, keyboard,
or monitor.
|
|
6.
|
Choose View > Refresh (Command-R).
|
|
7.
|
Locate the mouse in the report to verify that
it has changed places.
|
|
8.
|
Move the mouse to yet another free USB port
and refresh the report.
If you are using a monitor with built-in USB ports, try moving the
mouse to one of them or try plugging the mouse into a free USB port
on the back of the computer.
|
|
9.
|
Locate the mouse in the report.
|
|
10.
|
Plug the mouse back into its original USB
port.
|
|
11.
|
Select ATA in the Contents list.
|
|
12.
|
The report window now lists all of the ATA
buses in the computer and any devices connected to each bus.
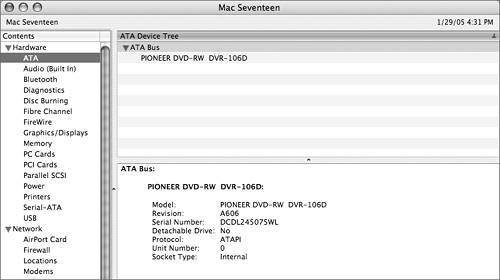 In this example, there is one ATA bus with a
Pioneer DVD drive connected. Note the model number, which can be
useful in researching driver versions.
|
|
13.
|
Select a hard disk
in the report. Depending upon your computer configuration, you
might need to select ATA or Serial-ATA.
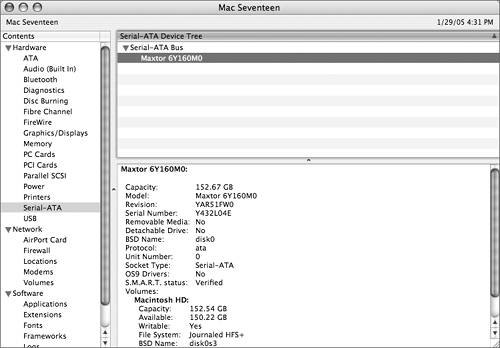 The lower pane lists details about the disk
drive, including the drive's capacity, serial number, and model
number. It also lists the disk drive's partitions and details about
each partition.
|
|
14.
|
Select Parallel SCSI in the Contents
list.
Unless a Parallel SCSI card has been installed in your computer,
the report pane displays "No information found."
|
|
15.
|
Select Graphics/Displays in the Contents
list.
Here you will see details about your video card.
|
|
16.
|
Quit System Profiler.
|